by A.A. Andales, T. A. Bauder and N. J. Doesken* (3/13)
Quick Facts….
- CoAgMet is a network of automatic weather stations that provides Internet access to weather and crop water use data.
- CoAgMet provides weather data in different formats, including daily or monthly summaries, hourly data, and graphs.
- Crop water use information from CoAgMet can be used in irrigation scheduling.
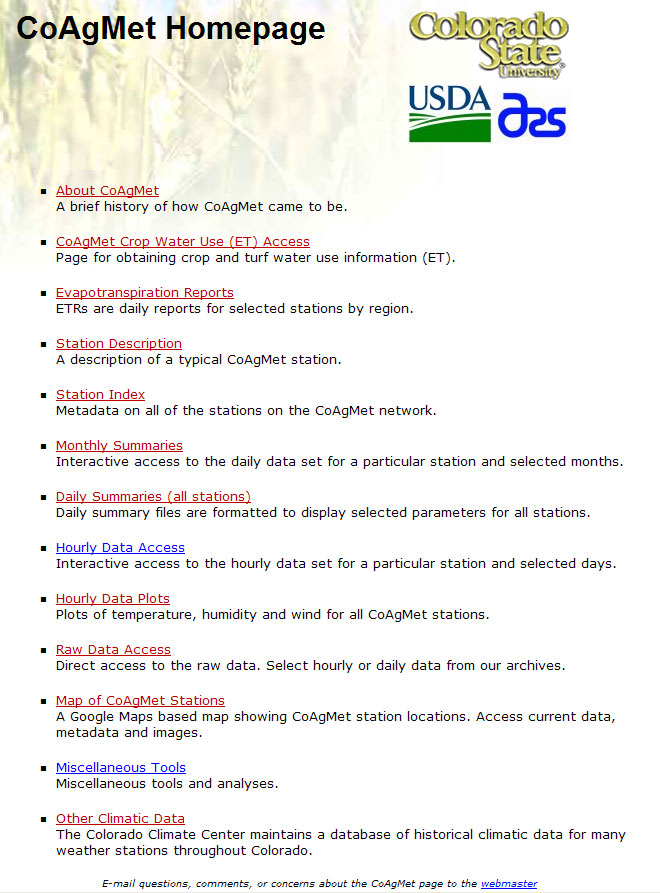 |
| Figure 1: The CoAgMet home page with links to different information. |
The Colorado Agricultural Meteorological Network (CoAgMet) is a network of automatic weather stations distributed across the state. Data collected by the network are available on the Internet at www.coagmet.com. Weather records date back to 1992 for the oldest stations, while the newer stations added to the network only have a few years of record. The home page of CoAgMet provides links to weather information and descriptions of various aspects of the network (Figure 1). Click on ‘About CoAgMet’ to see a brief history of the network. The ‘Station Description’ link provides a list of weather sensors typically installed on a CoAgMet weather station and their measurement characteristics. Click on ‘Station Index’ for a complete list of weather stations, their coordinates, and available dates of records. The ‘Map of CoAgMet Stations’ provides a resizable map of all the stations and can help find the one(s) nearest your location. Clicking on a specific station on the map will bring up links to summary information, a description, and photos of the station.
Summaries and Raw Data
Weather data from CoAgMet can be viewed in several formats. For those interested in daily values for a specific month and station, ‘Monthly Summaries’ provide users the option of selecting a year and a month for a specific station, plus setting options for calculating growing degree days (GDD). Accumulated
GDDs from a starting date (planting date for example) can be used to estimate where a crop is in terms of its development. Different crops require different amounts of GDDs to reach specific developmental stages and reach maturity. Those interested in seeing weather data on a specific date for all stations can click on ‘Daily Summaries (all stations)’.
Often times, it is easier to understand data if they are presented in graphs. The link for ‘Hourly Data Plots’ allows users to plot temperature, relative humidity, wind speed, wind direction, soil temperature, and solar radiation for a single day or up to an entire year at a selected station.
Advanced users who require hourly data can click on the ‘Hourly Data Access’ link. This link provides hourly data for a selected station on a single date. Therefore, it will give 24 values for each weather variable. Users interested in getting hourly or daily weather data that cover extended periods of time can click on ‘Raw Data Access’. This link provides the greatest control in downloading data. However, the data is given in comma-separated format, which is less user-friendly. A link to ‘Raw Data Documentation’ is provided at the bottom of the ‘Raw Data Access’ page to help users understand the data format.
The link for ‘Miscellaneous Tools’ provides daily data access linked to a Google map of the stations, daily statistics, and a user interface with more options for obtaining daily data for a specific station. Clicking on ‘Other Climatic Data’ takes the user to the homepage of the Colorado Climate Center, which provides links to a wider array of climate information.
Crop Water Use (ET) Access
CoAgMet provides daily crop water use or evapotranspiration (ET) reports for Colorado locations. ET reports from CoAgMet can be used to improve irrigation management and conserve limited water resources by fine-tuning irrigation timing and amount. Because ET is affected by our ever changing weather conditions, it can fluctuate daily and impact the demand for water by crops and landscapes. For example, mid-season corn water use can be as high as 0.40 inches per day when temperatures are in the mid-nineties, moderate wind, and low humidity, but will drop to half of that on cooler (low-eighties), more humid days. These changing weather conditions are measured by CoAgMet weather stations. The weather data is used to calculate and produce ET reports for several common crops. The CoAgMet website allows users to choose up to eight crops, one or more weather stations, and adjust their planting dates for customizing their reports. Daily as well as multi-day ET reports are available. Precipitation from the weather station is also included in the crop ET reports. This allows users to quickly determine a water balance for an area.
The concept of ‘reference crop ET’ was developed in the 1970’s to represent the potential amount of ET from a standardized unstressed crop, given adequate water and actual weather conditions at a particular location. The most common reference crops are cool-season grass (short reference) and alfalfa (tall reference) fully covering the ground. Historically, alfalfa has been used as the reference crop in Colorado. The ET of other crops can then be estimated by multiplying reference crop ET by a crop coefficient (Kc). At any given point in the growing season, the Kc for a crop is simply the ratio of its ET over reference crop ET. The Kc can be thought of as the fraction of the reference crop ET that is used by the actual crop. Values of Kc typically range from 0.2 for young seedlings to 1.0 for crops at peak vegetative stage with canopies fully covering the ground. CoAgMet users can choose the method used to calculate reference ET (ETr). There are several published equations that calculate ETr from weather data. Historically, CoAgMet has used the 1982 Kimberly Penman (KP) equation. However, the American Society of Civil Engineers Standardized Penman-Monteith (ASCE) equation is also offered as a user option. This newer equation has broad support in the literature as the standard equation. However, the ‘Crop ET Access’ page still defaults to the KP equation, because the crop coefficients used by CoAgMet were originally developed for this equation. Both of these equations are combination methods, meaning that they consider both the energy supply and the movement of water vapor at the crop surface to calculate ETr. The ETr values provided are for a tall (alfalfa) reference crop. The ET values for other crops are calculated automatically by multiplying ETr values with appropriate Kc values obtained from past experiments done in Colorado.
Finally, CoAgMet users will notice that weather stations have been categorized as dryland, partially irrigated or fully irrigated. These designations describe the predominant land use in the immediate vicinity of the weather station and/or the vegetation growing around the site. The best conditions for determining ETr include station location over mowed, preferably irrigated, grass and surrounded by irrigated crops. These conditions are often difficult to find and maintain in many remote areas. Additionally, some CoAgMet stations are purposely located in areas that are predominantly non-irrigated (dryland) as these stations were not intended for determining ETr. ET values from these sites will typically be higher than values from sites in fully irrigated areas. Weather stations were categorized using site characteristics as well as detailed analyses of historical weather data from each site.
Generating a Crop Water Use Report
To generate a customized crop water use report, first, go to www.coagmet.com. Next, click on CoAgMet Crop Water Use (ET) Access or go to http://ccc.atmos.colostate.edu/cgi-bin/extended_etr_form.pl to get to the Crop ET Access Page. Links to instructions on how to use the information and a map of the stations are provided at the top of the webpage. Click on either the ‘use as end’ or ‘start date’ option and choose the desired date to generate an ET rate report from past data. Choose the number of days needed for your ET report from the ‘# to do’ column.
If you clicked on the ‘use as end’ option, the selected date will be the last day in the report that goes back in time by the specified number of days in the ‘# to do’ column. For example, selecting June 30, 2009 as the end date and specifying ‘30’ in the ‘# to do’ column will generate a report that covers the period June 1 to June 30, 2009. On the other hand, clicking on the ‘start date’ option will give data starting on the selected date and going forward in time by the specified number of days in the ‘# to do’ column. ET rates are based upon weather data that logs from 12:00 midnight to 12:00 midnight. Therefore, ET rates and other weather data are not available for the current date until the following day.
Next, select the weather station(s) that will be used for the ET report. In most cases, the nearest weather station (see link to map at top of webpage) is the best choice unless you have specific knowledge that another station is more representative of your area.
If your location for ET rate is between two stations, consider using an average of both. To select multiple stations, hold down the control key and click on the stations you are interested in and CoAgMet will return data from all selected stations.
Finally, click on the desired crop(s) for ET rates. Select the planting date for the particular crop(s) of interest. Be aware that if crop emergence was delayed due to cool weather or other reasons, you may need to adjust the planting date back accordingly. For alfalfa, change the green-up date with each new cutting. Now, bookmark your ET output to avoid having to re-enter your preferred crop(s), station(s) and planting dates. Then you can go to your bookmark to obtain your customized ET report.
The daily ET rates from CoAgMet can be used in irrigation scheduling. See the fact sheet 4.707, Irrigation Scheduling: The Water Balance Approach for more details. Keep in mind that ET-based irrigation scheduling should be periodically verified by checking soil moisture in the field with a probe or shovel.
Example ET Report
An irrigation manager wants to know the total ET in the past seven (7) days for Yuma, Colorado. The current date is June 30, 2009. The crops of interest are corn planted on April 25, 2009 and dry beans planted on May 31, 2009. Given below are steps the manager should take to generate the appropriate ET report.
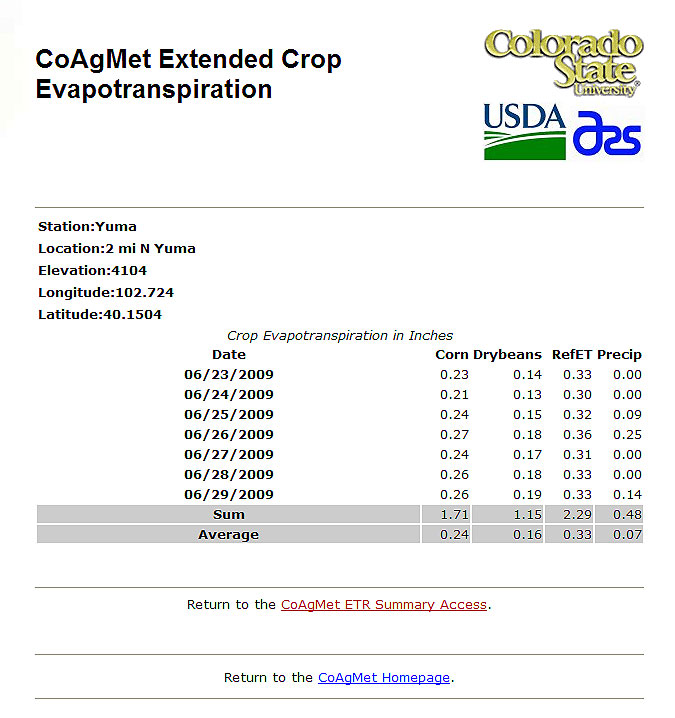 |
| Figure 2: Example ET report for corn and dry beans at Yuma, Colorado. |
- Go to www.coagmet.com using an Internet browser.
- Click on the ‘CoAgMet Crop Water Use (ET) Access’ link.
- Select June 29, 2009 for the date. Use this as the ‘end date’ and select ’07’ for ‘# to do’.
- Select ‘yum02 – Yuma’ as the station.
- Click ‘none’ under the ‘Select crops …’ section to unselect all the crops. Then click on the ‘Corn’ and ‘Dry beans’ boxes.
- Select m = 04 and d = 25 as the planting date for corn; and select m = 05 and d = 31 as the planting date for dry beans.
- Select ‘Penman-Kimberly’ as the ‘Reference ET Model’.
- Click the ‘Submit’ button.
The seven-day total (sum) ET for this example was 1.71 inches of water for corn and 1.15 inches for dry beans (Figure 2). In contrast, the total alfalfa reference ET (RefET) was 2.29 inches of water. Total precipitation for the same period was 0.48 inches. This means that precipitation was not enough to supply the ET requirements of corn and dry beans; and the crops would have taken most of their ET requirements from stored soil water.
*A.A. Andales, Colorado State University, associate professor, T. A. Bauder, senior research associate, soil and crop sciences; and N. J. Doesken, senior research associate, atmospheric science. 10/09. Revised 12/14.
Colorado State University, U.S. Department of Agriculture, and Colorado counties cooperating.
Extension programs are available to all without discrimination. No endorsement of products
mentioned is intended nor is criticism implied of products not mentioned.
Go to top of this page.