By A. Card, S. Bokan, T.Mason, and J. Schneekloth* (07/2021)
Quick Facts…
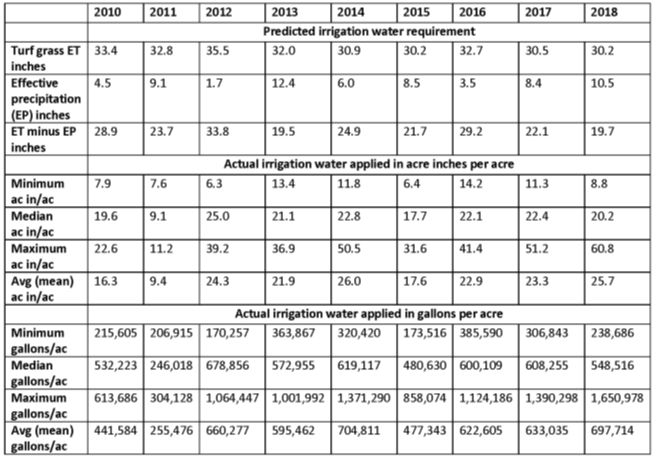
- Water use from 9 farms for 9 years averaged 21.5 inches per acre (583,811 gallons per acre) and ranged from 11.3 inches – 24.2 inches per acre.
- Subtract field level effective precipitation from turf grass evapotranspiration (ET minus EP) to create a rough guideline as inches of soil water to replace during the middle to end of a vegetable crop’s lifecycle.
- Actual farm water use coupled with ET minus EP form the basis of benchmarking mixed vegetable farm water use in Northern Colorado.
- Conversions: 325,851 gallons/acre foot, 27,154.25 gallons/acre inch, 43,850 sq ft per acre
It is crucial to meet vegetable crop water needs in the semi-arid west for optimal plant health, yield and produce quality that consumers demand. Vegetable crops in Colorado require supplemental irrigation to meet these goals. However, before the time of this publication, Colorado growers and agriculture professionals lacked baseline water use data for mixed vegetable farms in our region. Our objective was to quantify the amount of irrigation water in acre inches/acre applied by mixed vegetable farms in Boulder County, Colorado. This factsheet describes the results of a mixed vegetable farm irrigation water application study over nine field growing seasons and the use of local weather station data as means to benchmark mixed vegetable farm water use. These results and tools can be used by mixed vegetable producers with similar environmental conditions to understand how their water use compares to a group of producers in the Colorado high plains and how to reference weather data as an additional decision factor when scheduling irrigations.
Vegetable crop types vary in their tolerance of water depletion from the root zone (see CSU Extension factsheet, Determining Irrigation Run Times with Drip Tape on Specialty Crops – 5.623).
We speculate that in these mixed vegetable fields, growers typically defer irrigation management decisions to the crop with the highest water demands, meaning there was no way to irrigate to the water needs of individual crop types. Given that there are multiple vegetables grown with different water use characteristics in most small, mixed vegetable farm fields, irrigation efficiencies are not the same as would be anticipated when only one vegetable type is in an irrigation zone. Additionally, irrigation efficiency is highly dependent on the management practices of the irrigator. In this study, some farm managers incorporated soil moisture monitoring technology to determine soil moisture deeper than four inches in the soil profile, however many did not consistently utilize this technology. As such, it is likely that some over-irrigated or under-irrigated some or all the vegetable crops in an irrigation zone in order to meet the water needs of crops perceived to have the highest water demand.
Evapotranspiration (ET), or the collective water loss from the soil surface and plant leaves in the form of water vapor, can be influenced by air temperature, solar radiation, crop canopy, natural or plastic mulch, soil cultivation/tillage events, leaf surface area, wind velocity, and relative humidity.ET amounts are typically reported in inches.
The United Nations Food and Agriculture Organization (FAO, 1998) indicates that the ET rate for vegetable crops is similar to that of turf grass. Thus, turfgrass ET (abbreviated at ETo in the FAO publication) is a surrogate that can be used to estimate vegetable crop water use. Use of the abbreviation ET in this factsheet refers to turf grass ET.
ET varies based on stage of crop development. For example, vegetable crops consume from 40 – 70% of ET during their initial establishment period then progressively move to 100 – 115% of ET during their middle growth and/or fruit set period, then end at 55 – 95% of ET during their fruit fill and finish period (FAO, 1998).
Rainfall also factors into vegetable crop irrigation scheduling. Effective precipitation (EP) events drop 0.10 inch or more of rainfall and contribute to soil water in the root zone.It is important to understand that the measured EP may not always be effective. In raised bed production systems using plasticulture, for instance, the plastic mulch may prevent EP from entering the plant root zone. Similarly, measured rainfall with significant run-off, without infiltration into the soil, may overestimate the actual EP.
Growers with turf grass ET available from an online source can use this data to develop a running total of inches of water consumed by vegetable crop production. Irrigation science uses the abbreviation ETo for turf grass ET and online sources will report it as ETo. Subtracting field level EP from ET (ET minus EP) creates a rough guideline for determining inches to replace through irrigation during the middle to the end of a vegetable crop lifecycle (refer to the previous FAO section of this factsheet) and, along with actual farm water use reported here, is the basis in this factsheet for benchmarking water use on mixed vegetable farms in Northern Colorado. While field-specific EP rainfall data may vary, ET is highly representative of field conditions when a weather station is accurately reporting this data at a similar latitude and elevation as the field of interest.
Turf grass ET varies, but during the peak ET months for vegetable crops of June, July and August, turf grass ET is typically 0.20 – 0.33 inches per day in Northern Colorado.
Methods
Daily ET and tipping bucket rainfall data were imported from the Northern Colorado Water Conservancy District weather station, Longmont South, near the intersection of highway 287 and highway 52. This location was chosen as a reference point because it was generally a central location to all the farms included in this study and in an area with less urban environmental impacts to ET.
From 2010 through 2018 staff from the CSU Extension, Boulder County office installed totalizing water flow meters (propeller magnetic drive types from Master Meter, GPI and McCrometer factory calibrated, on 5/8-inch to 6-inch pressurized irrigation supply lines) delivering irrigation water to drip and/or sprinkler systems on mixed vegetable fields in the county and took measurements May – October of acres irrigated, as a total of acres in drip irrigation plus acres in sprinkler irrigation, and gallons used as reported at the flow meter. Flow meters served one or more irrigation zones. Each fall flow meters, measuring raw ditch water, were cleaned to ensure measurement accuracy. Field areas ranged from 1.4 – 20.8 acres irrigated during the mixed vegetable crop irrigation season studied (May to October). Data from nine farms, comprising 17 mixed vegetable fields, produced 78 observational units used in this study. The total amount of irrigation provided (acre inches/acre) was normalized to a per day usage by accounting for the length of time that irrigation was provided. For comparison purposes, all data presented is based on a 160-day irrigation season.
These fields had either multiple vegetable crop types from the same plant family (e.g. – various winter squash types, all Solanaceae family crops, etc.) or several plant families within the field (Apiaceae, Asteraceae, Brassicaceae, Cucurbitaceae, Solanaceae, etc.). Within the field, irrigation zones, if present, seldom had only one vegetable crop type.
Results
Water use across all farms and all years averaged 21.5 inches per acre and ranged from 11.3 inches – 24.2 inches per acre (Figure 1). There was no statistical difference between sprinkler or drip irrigation.
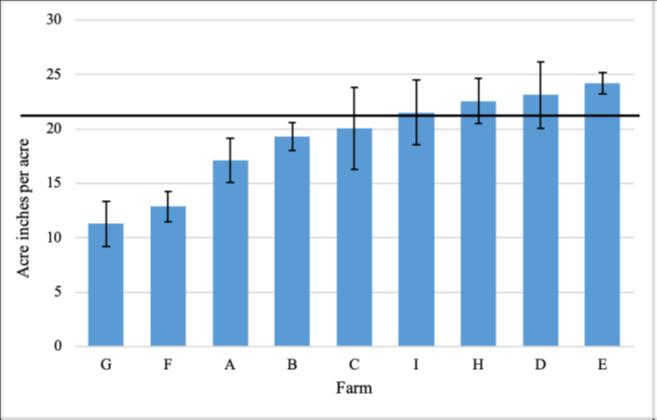
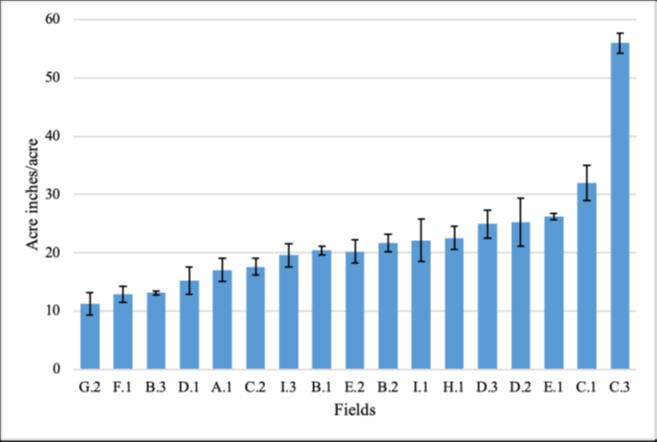
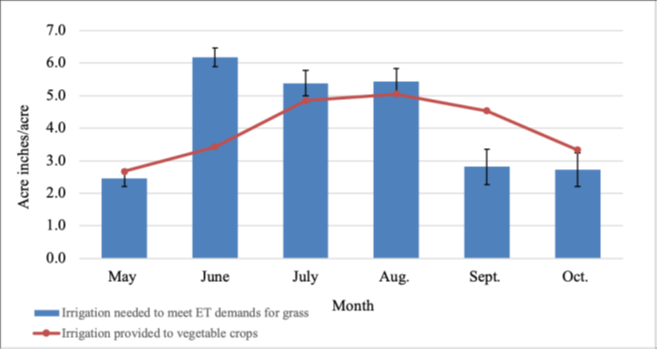
Figure 3 shows that growers in this study were meeting crop water needs or potentially under irrigating during crop establishment in June (based on 40-70% of ET as cited by the FAO) while likely over irrigating in September. Although irrigation applied in June is less than the predicted ET, this generally represents the time period of establishment for most vegetable crops when vegetable ET is less than turf grass ET. However, irrigation in September and October was greater than turf grass ET. This would represent an opportunity for producers to reduce irrigation applied in excess of turf grass ET during those late season months.
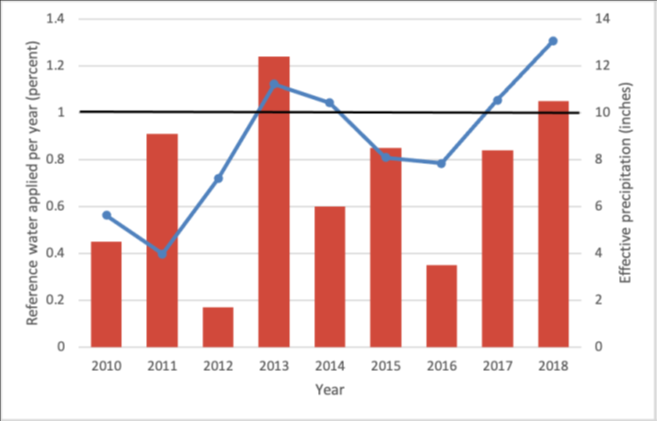
In Figure 4 the average water use (blue line) of all fields cited in the research closely matches the ET – EP benchmark in years 2012 – 2017. Years below “1” indicate average water use of all farms was less than ET – EP and years above “1” indicate average over irrigation by farms in this model. In drought years of 2012 and 2016 (indicated by EP less than 5 inches) growers applied 70% or more of vegetable crop water needs predicted by the ET – EP benchmark. However, in drought year 2010, growers in this study applied the least amount of predicted crop water needed during a drought at just under 60%. In September of 2013 Boulder County experienced a 1000-year flood event, which explains the high amount of EP during that year.
The 2011 growing season shows high EP but a 60% underirrigation as an average of all fields in the study. This may support the need for soil moisture monitoring in a wet year, when periodic rain storms give the appearance of ample moisture in the top 4 inches while soil below that depth may have exceeded a management allowable depletion (see CSU Extension factsheet, Determining Irrigation Run Times with Drip Tape on Specialty Crops – 5.623).
Conclusions
Although this study cannot represent the actual crop water needs by growth stage of the multiple crops planted in the same irrigation zone with multiple planting dates, it does offer a reference benchmark from the research findings presented here, allowing growers to assess mixed vegetable farm water use retrospectively against a range and average of historical water use. Produce growers can also utilize the ET minus EP benchmark to calculate a daily or weekly estimate of vegetable crop water needs during the season as well as to conduct a similar retrospective analysis of farm water use.
By installing and maintaining flow meters serving one or more fields, gathering seasonal acre inches or gallons of water used, compiling ET and EP data (rainfall ideally from the farm field), and comparing actual farm water applied to the research summary presented here and to their estimate from the ET minus EP model, mixed vegetable farmers have new benchmarking tools for understanding how much irrigation water should be applied (see CSU Extension factsheet, Determining Irrigation Run Times with Drip Tape on Specialty Crops – 5.623 for calculating run times) and applying amounts to match crop water demand. Additionally, those seeking to convert fields to mixed vegetable crop production now have a water volume benchmark for securing appropriate water supply to fulfill that goal.