By D.G. Sterle and I.S. Minas (3/24)
Quick Facts
- ‘Cresthaven’ and ‘Suncrest’ are much less hardy from phenology stages 2-4 than classic cold hardiness charts would indicate.
- Most hardiness is lost by the beginning of stage 3-“red calyx”.
- ‘Suncrest’ reached stage 3-“red calyx”, two days earlier than ‘Cresthaven’.
- Moisture content is highly correlated with bud hardiness and phenology stage.
- At equal phenology stage ‘Suncrest’ is as hardy as ‘Cresthaven’ despite California heritage, showy petals and low chilling requirement.
- New updated cold hardiness charts per phenology stage were developed and presented herein for ‘Suncrest’ and ‘Cresthaven’.
Introduction
Cold damage to floral tissues represents the greatest threat to profitable yields for peach growers. Differential thermal analysis (DTA) can be used to accurately measure lethal temperatures of hundreds of peach floral buds during a relatively short process (Mills et al., 2006; Minas et al., 2020; Sterle and Minas, 2023, Sterle et al., 2023). While DTA reliably provides accurate data from post-leaf senescence through bud swell, DTA loses the capacity to detect lethal temperatures during deacclimation. As peach floral buds deacclimate following chilling satisfaction in the lead up to bloom time, cold hardiness is rapidly lost as the buds begin to rapidly change. Moisture content begins to rise as xylem connectivity is restored to the reproductive organs. It is also known that a multitude of metabolic changes are happening within the floral tissues, as dormancy is released reducing frost tolerance in reproductive tissues. Accurate knowledge of cold hardiness during these critical phenological stages will help growers more effectively protect their crops.
Pre-bloom floral buds being extremely vulnerable to damage is a well established reality for peach growers worldwide. Each progressive phenological stage is associated with a lowering of frost tolerance as the flower develops into a fruitlet. However, when previous studies have documented freezing thresholds across different phenological stages it was done with antiquated technology, and with a cultivar (‘Elberta’) which is no longer widely planted by Colorado and other peach growers around the world. This study tests cold hardiness of ‘Cresthaven’ and ‘Suncrest’ peach, two widely grown mid-season peach cultivars, across many stages of bud phenology.
Peach growers tend to believe cold hardiness has often been attributed to flower petal phenotype. For instance, cultivars with large, showy petals such as ‘Suncrest’ has been associated with being less cold hardy than a cultiver like ‘Cresthaven’ which has small non-showy flowers (Figure 2.1a). This characteristic has not been sufficiently compared to identify whether the difference in hardiness is real or perceived. Another characteristic commonly associated with hardiness is the place of origin in which a cultivar was bred. Cultivars coming from California are often considered more tender, whereas those originating in Michigan are considered more hardy. Whether the difference in late-fall and mid-winter hardiness is universally true, or more-likely to be true is an open question.
Breeders in warmer regions often prioritize selection of cultivars with low chilling requirements in order to ensure a full and uniform bloom. ‘Suncrest,’ a California bred cultivar (USDA, Fresno, CA, 1959) requires around 550 chill hours (between 32–45ºF), while ‘Cresthaven,’ a Michigan bred cultivar 1963 at the Michigan Agricultural Experiment Station, 1963), requires around 850 chill hours. Cultivars bred in cold locations are more likely to be selected by breeders if they develop a consistent track record of surviving cold events, so there is a selection mechanism which could be expected to lead to more cold hardy lineages of peach.
Affecting orchard temperatures through frost protection measures is energy intensive and has limited efficacy (Beyá-Marshall et al., 2019). While floral buds deacclimate, they quickly lose cold hardiness. Since grower profitability depends on the survival of floral buds, it is necessary to know the precise temperature at which floral buds are vulnerable to frost damage. Therefore, it is necessary to revisit classic studies of heritage cultivars to ensure each phenology stage of currently used cultivars are as cold hardy during deacclimation.
Materials and Methods
From March 18 to April 18, 2022, 25 samples of fruiting (proleptic) shoots were taken every 2-4 days from mature ‘Suncrest’ (9 yr. old) and ‘Cresthaven’ (10 yr. old) trees. Samples were taken from a uniform height of ~4.5 ft above ground level. To represent the primary fruit bearing portion, shoots were shortened to basal sections 1 foot in length. For each day, a phenology stage was ascribed to each cultivar. The phenology stage was the most advanced stage which described at least 40% of the buds in the sample for each cultivar. Fifteen floral buds per date were weighed, freeze dried, and re-weighed to determine the moisture content at each stage.
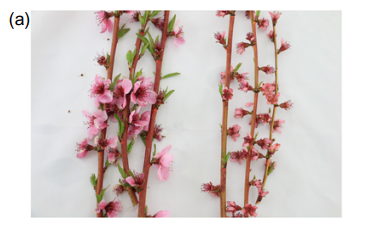
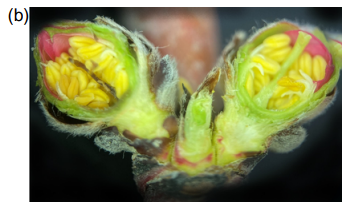
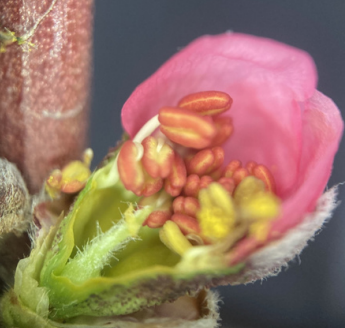
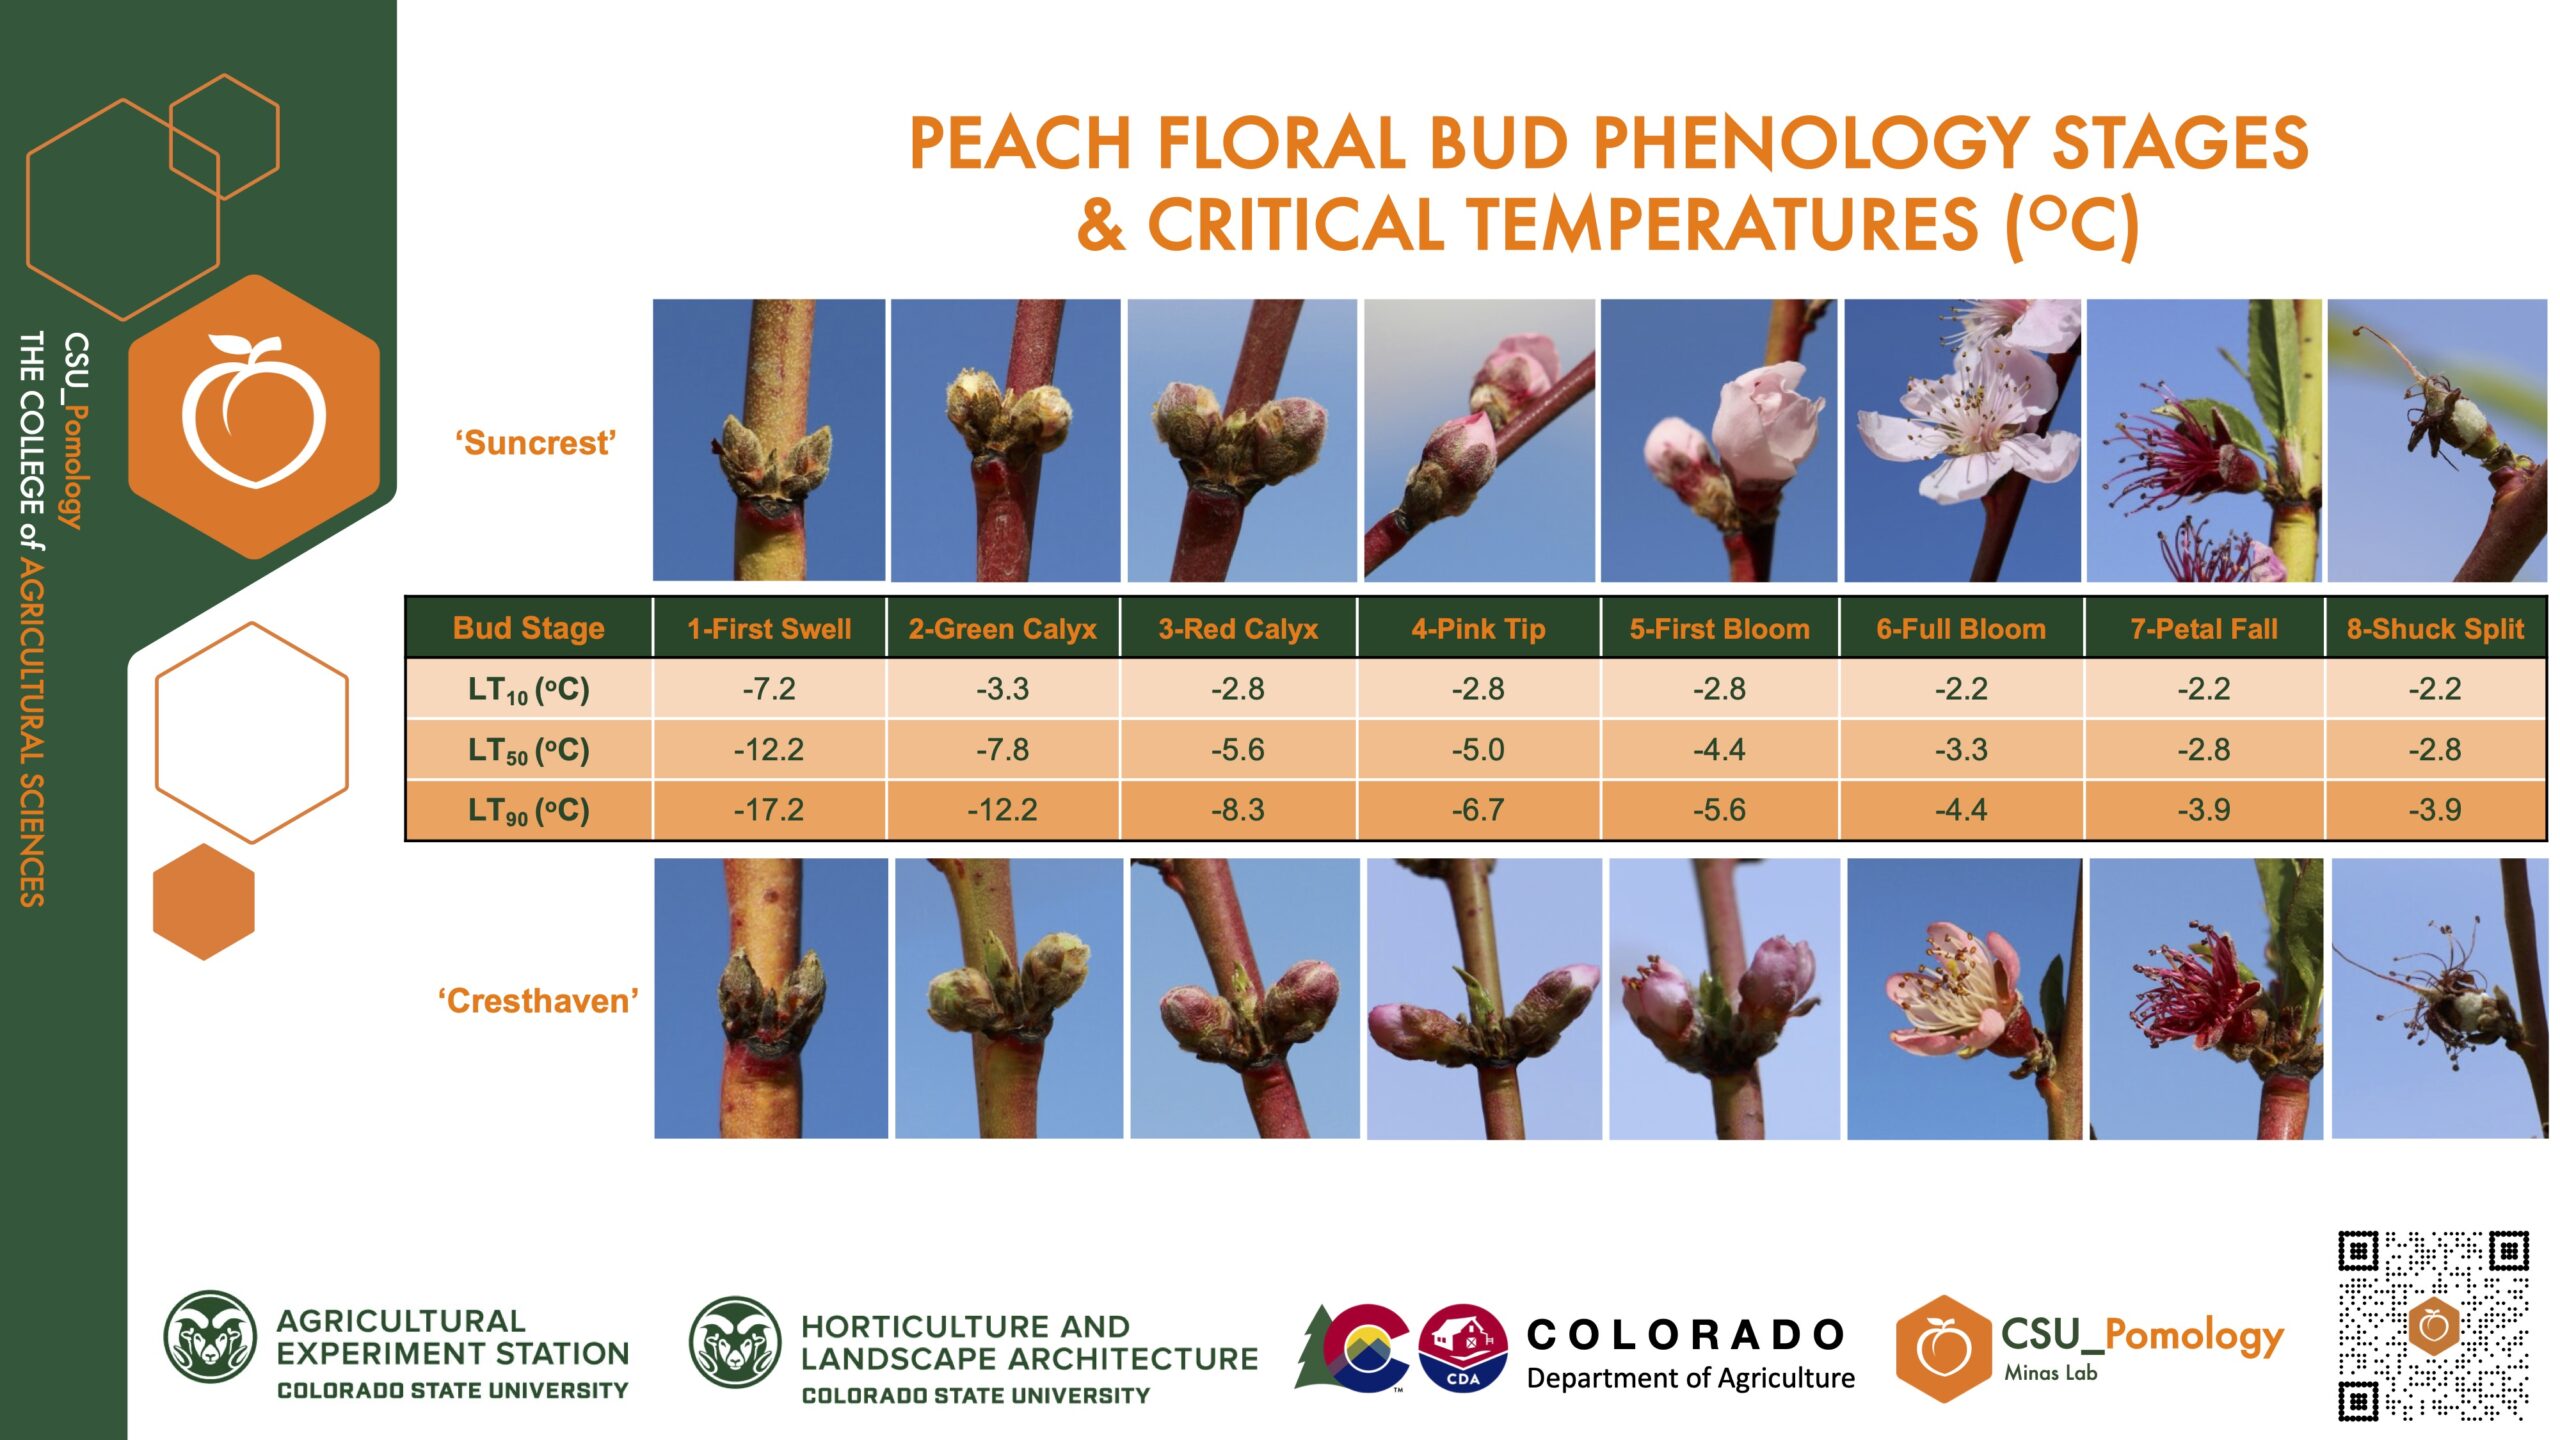
Figure 2.1. External and internal morphology of peach floral buds. (a) Samples of 1 ft long fruiting shoot sections during bloom, demonstrating stark differences in flower morphology. Three ‘Suncrest’ shoots with showy flowers are on the left and three ‘Cresthaven’ shoots with nonshowy flowers are on the right. (b) Longitudinally sectioned buds of ‘Suncrest’ during stage 3-“red calyx”. Showing live pistil within the right bud, and an oxidized pistil in the left bud which would prevent pollination of these flowers. The viability of anthers and petals indicated by a lack of oxidative browning, indicates these tissues were more frost tolerant during this stage.
Sample shoots were frozen within a programmable freezing chamber (Tenney Jr Test Chamber, Model TUJR 1.22 cu.ft., Thermal Product Solutions, New Columbia, PA, USA), being lowered to 4 sets of predetermined temperatures per date. Temperature within the chamber dropped at a rate of 7.2 degrees Fahrenheit (ºF) per hour. Each predetermined target temperature was set to hold for 30 minutes, and one set of 5 shoots per cultivar were removed before dropping to the next targeted temperature. All shoots were left at room temperature in high relative humidity conditions for 24 hours, and then flower buds or flowers were longitudinally sectioned with a razor blade. Survival was determined by the presence or absence of significant oxidative browning to the pistil of each flower bud per target temperature (Figure 2.1b). Percentage of dead buds were tallied for each individual temperature. Linear regression was used to determine the relationship between percent mortality and temperature. Slope and intercept were calculated through linear regression, and then used to calculate the lethal temperatures of 10%, 50%, and 90% of buds (LT10, LT50, and LT90, respectively).
2.3. Results and Discussion
Several surprising results came about through this study with regards to cold hardiness of buds of different cultivars and phenology stage (Figure 2.2). Critically, there was a great difference in the projected cold hardiness of ‘Elberta’ from classic literature, at bud stages 2–4 (“green calyx”– “pink tip”). The average LT50 of ‘Suncrest’ and ‘Cresthaven’ compared to the LT50 of ‘Elberta,’ across phenology stages, was 5.2ºF less hardy at stage 2-“green calyx,” 7.0ºF less hardy at stage 3-“red calyx,” and 3.0ºF less hardy at stage 4-“pink tip.” There was very little difference between the two cultivars at equal bud stages, despite their apparent phenotypic differences. ‘Suncrest’ was less hardy overall however, since it reached Stage 3-“red calyx,” a tender stage two days earlier. Ultimately ‘Suncrest’ reached full bloom one day earlier (April 7, 2022) than ‘Cresthaven’ (April 8, 2022). There were almost perfect linear relationships between LT50, and bud moisture content (R²= 0.97 for ‘Suncrest’, and R²= 0.98 for ‘Cresthaven’; Figure 2.3a) and did not differ by cultivar. The relationship between phenology stage and moisture content was a nearly perfect logarithmic curve (R² 0.98; Figure 2.3b) and did not differ between cultivars.
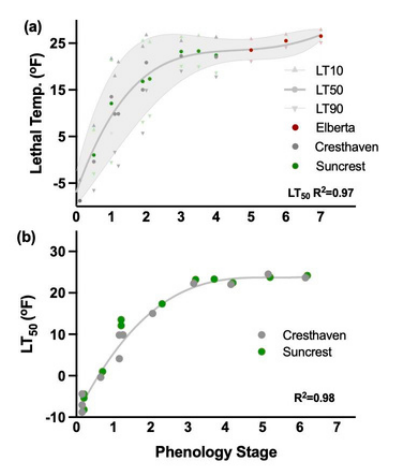
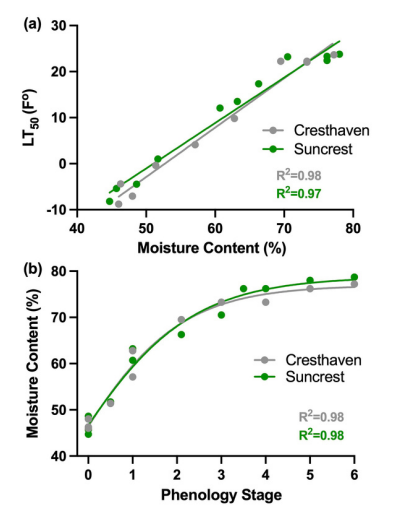
Figure 2.2. Relationship of cold hardiness with phenology stage of two different cultivars (a) Redeveloped lethal temperature thresholds for peach floral buds as determined by rigourous oxidative browning testing across seven phenological stages. (b) Lethal temperatures (LT50) for ‘Suncrest’ and ‘Cresthaven’ peach floral buds along with a logarithmic regression curve highligting the relationship between developmental stage and LT50.
Figure 2.3. Relationships among cold hardiness, moisture content and developmental stage. (a) Linear regression showing that 97-98% of the variability in LT50 is explained by the moisture content of the floral bud, with no meaningful difference between the two cultivars. (b) Logarithmic non-linear regression showing that 98% of the variability in moisture content is explained by the developmental growth stage.
These results reveal the value of testing classical assumptions, such as floral bud hardiness, developed in other locations with outdated cultivars, using locally specific research. The results also provide a new perspective on the perceived differences between attributes such as location of breeding program origin (CA vs. MI), flower petal size (large and showy vs. small and non-showy) and chilling requirement (550-850 chill hours, 32–45ºF). While there was a difference between the two cultivars, the only real difference was a slight acceleration in bud phenology development in the ‘Suncrest.’ It is important to understand that this relationship will not necessarily hold true for every cultivar.
2.4. Conclusion
These results highlight that the differences between cultivars are more complicated than binary comparisons across several traits, and that low chill, large showy petals of CA bred peach cultivars are not implicitly far less cold hardy than their MI alternatives. The results suggest that cold hardiness differences between two phenologically different cultivars are more related to the bud stage of each cultivar. Also noteworthy is the relationship that moisture content has with both cold hardiness and phenology stage. New updated cold hardiness charts per phenology stage are presented in this article in Fahrenheit (ºF) and Celsius (ºC) for ‘Suncrest’ and Cresthaven’ to be used by the industry.

2.5. References
Beyá-Marshall, V., Herrera, J., Santibáñez, F., Fichet, T. 2019. Microclimate modification under the effect of stationary and portable wind machines. Agric. For. Meteorol. 269–270, 351–363.
Mills, L.J., Ferguson, J.C., Keller, M. 2006. Cold-hardiness evaluation of grapevine buds and cane tissues. Am. J. Enol. Vitic. 57, 194-200.
Minas, I.S., Sterle, D. 2020. Differential thermal analysis sheds light on the effect of environment and cultivar in peach floral bud cold hardiness. Acta Hortic. 1281, 385–391.
Sterle, D.G., Minas, I.S. 2023. Cold hardiness assessment of peach flower buds using differential thermal analysis (DTA) in western Colorado (dormant season 2023-24). Retrieved December 12, 2023, from https://agsci.colostate.edu/minas/tree-fruit-information/coldhardiness/
Sterle, D.G., Caspari, H.W., Minas, I.S. 2023. Optimized differential thermal analysis sheds light on the effect of temperature on peach floral bud cold hardiness and transition from endo-to ecodormancy. Plant Science 335: 111791.