by Adrian Card & Troy Bauder* (9/19)
Quick Facts….
- Drip irrigation is designed to apply relatively low volumes of water more efficiently than other irrigation systems.
- When not properly managed, any increase in irrigation efficiency provided by a drip system can be lost.
- Crops extract about 70% of plant available water from the upper half of their root system.
- Application efficiency of drip irrigation is approximately 90%.
Drip irrigation is well suited for most vegetable crops because these crops
typically require frequent, shallow irrigations due to their shallow rooting depths. Drip irrigation is designed to apply relatively low volumes of water more efficiently than other irrigation systems. However, when not properly managed, any increase in irrigation efficiency provided by a drip system can be lost. Applying irrigation water at the right time and in the right amount for optimal plant health is one important factor for consistently high yields. While in salt affected soils growers may need to over irrigate to flush salts out of the root zone, excessive water application has the potential to reduce yields by leaching nitrate-nitrogen below the depth of the root zone and cause plant health problems due to less air and more water in soil pores. Conversely, water shortage also reduces plant health and thus crop yields.
A key point to remember, particularly with buried drip tape versus drip tape on the soil surface, is that the emitted water from the tape will immediately move down in the soil due to gravity at the same time it moves up. With buried drip tape, irrigating until the moisture is seen in a wide band on the soil surface will often cause a portion the applied water to move below the root zone, resulting in lost water and nutrients.
Specialty crop irrigation scheduling with drip tape can be done effectively with six pieces of information: 1) Available Water Capacity (AWC) per
foot of soil based on soil texture, 2) Management Allowed Depletion (MAD)
for a specific crop, 3) current crop rooting depth and Maximum Rooting
Depth (MRD), 4) soil water depleted, 5) drip tape flow rate, and 6) estimated drip tape efficiency. For related information see fact sheet 4.707.
Available Water Capacity (AWC) “How much do you have?”
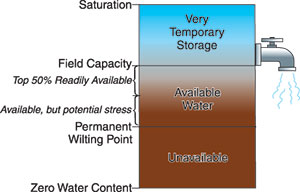
Figure 1: Graphic representation of soil water concepts
Soil is like a sponge. It can be filled only to a maximum volume of water and then water drains downward due to gravity. This state is called field capacity and reflects total soil water. Field capacity can be measured in inches of water and varies by soil texture (percent sand, silt and clay). Plants can extract the water in the soil until the point at which the soil holds the water with more force than the plants can exert to extract it, thus only a portion of the total soil water is available to plants. When no water is available for plant root uptake this is referred to as permanent wilting point and results in plant death. AWC is the inches of field capacity that plants can readily extract and is calculated as field capacity minus wilting point. AWC also varies by soil texture. Refer to charts below or have your soil tested to determine AWC per foot of soil for your soil texture.
Figure 2: Management Allowed Depletion (MAD) and Maximum Rooting Depth (MRD) values by crop
The chart below shows average percent MAD of soil moisture for various crops with MRD in inches. Plant growth stage and compacted layers affect rooting depth. NOTE: adjust MRD based on plant growth stage and local soil conditions. Forage crops are shown for comparison.*
| Crop | % MAD | MRD (inches) | Crop | % MAD | MRD (inches) |
| Alfalfa | 55 | 48 – 72 | Kale | 30 | 18 – 24 |
| Apples | 50 | 39 – 78 | Leek | 30 | 12 – 18 |
| Asparagus | 40 | 46 – 70 | Lettuce | 30 | 12 – 20 |
| Beans (green) | 45 | 20 – 27 | Melons (other) | 40 | 31 – 59 |
| Beets | 50 | 23 – 39 | Onions | 25 | 12 – 23 |
| Broccoli | 50 | 16 – 23 | Okra | 30 | 18 – 24 |
| Brussel sprouts | 30 | 16 – 23 | Parsnip | 40 | 18 – 24 |
| Cabbage | 45 | 20 – 31 | Peaches | 50 | 24 – 36 |
| Cantaloupe | 40 | 24 – 48 | Peas | 35 | 12 – 24 |
| Carrots | 35 | 20 – 39 | Peppers | 25 | 20 – 39 |
| Cauliflower | 50 | 16 – 27 | Potatoes | 25 | 16 – 24 |
| Celery | 20 | 12 – 20 | Pumpkin | 40 | 36 – 48 |
| Chard | 50 | 18 – 24 | Radishes | 30 | 12 – 20 |
| Cucumber | 50 | 18 – 24 | Raspberries | 50 | 12 – 24 |
| Chinese cabbage | 30 | 12 – 18 | Rhubarb | 80 | 18 – 24 |
| Collards | 50 | 12 – 18 | Spinach | 20 | 12 – 20 |
| Corn (sweet) | 50 | 31 – 47 | Strawberries | 20 | 12 – 24 |
| Eggplant | 45 | 18 – 24 | Summer squash | 30 | 12 – 24 |
| Grapes (table) | 35 | 36 – 60 | Sweet potato | 65 | 24 – 36 |
| Grapes (wine) | 45 | 36 – 60 | Tomatoes | 40 | 24 – 48 |
| Grass (hay) | 50 | 18 – 30 | Watermelon | 40 | 24 – 36 |
| Hops | 50 | 36 – 60 | Winter squash | 40 | 36 – 48 |
*Aggregated from: “Scheduling Irrigations: When and How Much Water to Apply”, Blaine Hansen, et al., UC Davis, 1999”; “UN Food and Ag Organization, Crop ET – Guidelines for computing crop water requirements”; “Vegetable Crop Irrigation, D.C. Sanders, NC State University Extension, 1997”; Chapter 11, “Sprinkler Irrigation,” Section 15, Natural Resources Conservation Service National Engineering Handbook. MAD values show majority finding in literature or err on conservative value in literature (keeping soil wetter) when publications listed different values. MRD values err on shallow side to reflect Colorado growing season and related limitations of annual crop rooting depth.
Management Allowable Depletion (MAD) “How much can you lose?”
MAD is the plant tolerated loss of AWC and varies for specialty crops. MAD can be expressed as a percent or in inches. Growers should not exceed the MAD for each crop and need not wait to irrigate until the MAD “red line” is reached. A yield loss will be incurred when MAD is exceeded. For different crops in the same irrigation zone, use the crop with the smallest MAD value to represent the entire zone. For example, a sandy clay loam holds 1.8 inches of water per foot of soil. The MAD for peppers is 25%, thus this soil can be depleted by 0.45 inches below AWC (1.8 AWC x 0.25 MAD% = 0.45 MAD inches).
Rooting Depth “Where is it?”
Crops extract about 70% of plant available water from the upper half of their root system. Sample soil moisture for fully rooted crops from half the depth of the Maximum Root Depth (MRD) to determine when to irrigate (how close to MAD) and how much water to apply based on inches of soil water depleted. If unsure, a generic sample from about 9 inches deep should be representative for most fully rooted vegetable crops in Colorado. Sample shallower than half the MRD if the crop is not fully rooted. Samples should represent the average soil moisture conditions for crop roots and should be taken 4 – 6 inches away from both the crop and the drip tape.
Water Depletion “How much is there now?”
There are several methods to determine current inches of soil water depleted. Once soil texture is known, a low tech and less accurate method to determine current soil water depletion with a soil sample is the feel and appearance method. Take a sample with a soil probe to the appropriate depth based on crop rooting. Refer to the NRCS publication “Estimating Soil Moisture by Feel and Appearance” and note images and description for AWC and percent soil water available and inches depleted.
Another method utilizes soil water sensors that remain in the field to determine soil dryness in units of centibars. Centibars are a unit of measure for soil tension, or how strongly the soil is holding soil water. For example and based on Figure 3, a sandy clay loam holds 1.8 inches of water. At 40 centibars that soil has 1.3 inches of water available and is 28% depleted (1.8 inches AWC minus 1.3 inches water available = 0.5 inch depleted. 0.5 inch depleted/1.8 inches AWC = 28% depleted). Once MAD is known for an irrigation zone monitored by these sensors, doing the calculation once to determine the MAD equivalent centibars will help with irrigation management by establishing that “red line”. Some vendors provide wireless sensors, allowing growers to set a MAD for a soil water sensor report and view hourly soil water graphs via internet connected devices. This allows growers to see both soil water increases (irrigation and rain events) and decreases (evaporation from soil and transpiration from the crop) and making it simple to see when decreases are nearing the MAD value. Remote sensing of soil moisture greatly reduces monitoring effort and expedites irrigation management.
Figure 3: Approximate soil moisture tension and available water for sandy and loamy soils
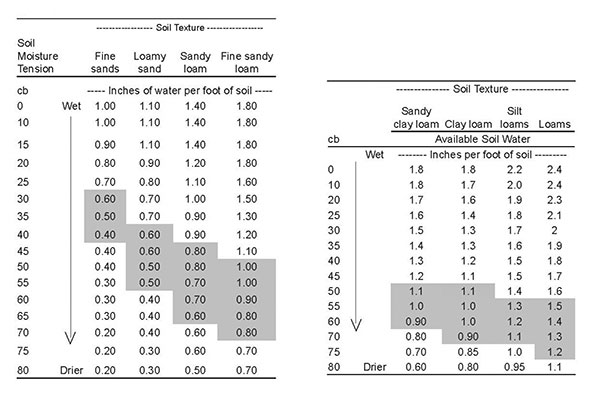
Refer to pages 19 and 20 in the “Irrigated Field Guide and Record Book”
Drip Tape Flow Rate
Many are familiar with sprinkler irrigation and the measurement of water
applied in inches while drip output is given in gallons. It is possible to figure inches of water applied with drip tape given two variables:
- Flowrate of drip tape used – measured in gallons/minute per 100 ft of tape (if in gallons/hour, divide by 60 to get gal/min)
- Tape spacing – inches between tapes on or between planted beds, not emitter spacing in the tape
Figure 4: Inches of water per hour for various drip tape flow rates and tape spacings
Refer to the following chart to determine the output of inches per hour from your irrigation system.
| Tape Spacing inches) | Drip Tape Flow Rate (gal/min per 100ft) | |||||||||||
| 0.2 | 0.25 | 0.3 | 0.35 | 0.4 | 0.45 | 0.5 | 0.55 | 0.6 | 0.65 | 0.7 | 0.75 | |
| 12 | 0.19 | 0.24 | 0.29 | 0.34 | 0.39 | 0.43 | 0.48 | 0.53 | 0.58 | 0.63 | 0.68 | 0.73 |
| 14 | 0.17 | 0.21 | 0.25 | 0.29 | 0.33 | 0.37 | 0.41 | 0.46 | 0.50 | 0.54 | 0.58 | 0.62 |
| 16 | 0.14 | 0.18 | 0.22 | 0.25 | 0.29 | 0.32 | 0.36 | 0.40 | 0.44 | 0.48 | 0.52 | 0.56 |
| 18 | 0.13 | 0.16 | 0.19 | 0.22 | 0.26 | 0.29 | 0.32 | 0.35 | 0.38 | 0.41 | 0.44 | 0.47 |
| 24 | 0.10 | 0.12 | 0.14 | 0.17 | 0.19 | 0.22 | 0.24 | 0.27 | 0.29 | 0.32 | 0.34 | 0.37 |
| 30 | 0.08 | 0.10 | 0.12 | 0.13 | 0.15 | 0.17 | 0.19 | 0.21 | 0.23 | 0.25 | 0.27 | 0.29 |
| 60 | 0.04 | 0.05 | 0.06 | 0.07 | 0.08 | 0.09 | 0.10 | 0.11 | 0.12 | 0.13 | 0.14 | 0.15 |
Adapted with permission from “Drip Irrigation for Row Crops”, Blaine Hansen, et al., UC Davis, 1997
Drip Tape Efficiency
Application efficiency of drip irrigation is approximately 90%. This efficiency must also be factored in the calculation to determine run time.
Run Time Calculation Example
Soil texture is a sandy clay loam with AWC of 1.8 inches per foot of soil. MRD for peppers is 20 inches deep. Soil samples are taken from 9 inches deep. Soil moisture assessment indicates soil is approximately 37 centibars and 25% depleted. MAD for peppers is 25% so the soil is at MAD. Time to irrigate as further drying will reduce plant health and yields.
1.8 inches of water per foot of soil x 0.25 depletion = 0.45 inch of water to be replaced in the top foot of soil.
Drip tape has flowrate of 0.35 gallons of water/minute per 100 feet of tape
and tapes are spaced 12” inches apart on the bed, giving a conversion of 0.34 inch of water per hour based on the table above.
0.45 inches of water to be replaced divided by 0.34 inches of water per hour = 1.32 hours 1.32 hours x 60 minutes/hour = 79 minutes. Initial run time is 79 minutes.
Initial run time of 79 minutes divided by 0.90 application efficiency = 88 minutes to replace 0.45 inches of water to 12 inches deep.
*Adrian Card, Agriculture Agent, CSU Extension and Troy Bauder Assistant Deputy Director, CSU Agricultural Experiment Station