by J. Schneekloth and A. Andales* (2/17)
Quick Facts….
- Knowing seasonal crop water requirements is crucial for planning your crop mixture.
- Net crop requirements are estimated using models, based on weather variables.
- To irrigate for the greatest return, producers need to understand how crops respond to water, how crop rotation enhances water availability, and how changes in agronomic practices affect water needs.
Crop water use, consumptive use and evapotranspiration (ET), are terms used interchangeably to describe the water consumed by a crop. This water is mainly used for cooling purposes; a negligible amount is retained by the crop for growth. For more information on ET and growth stages, refer to fact sheet 4.715, Crop Water Use and Growth Stages.
Water requirements of crops depend mainly on environmental conditions. Plants use water for cooling purposes and the driving force of this process is prevailing weather conditions. Different crops have different water use requirements, under the same weather conditions. Crops will transpire water at the maximum rate when the soil water is at field capacity. When soil moisture decreases crops have to exert greater forces (energy) to extract water from the soil. Usually, the transpiration rate doesn’t decrease significantly until the soil moisture falls below 50% of available water capacity.
Knowing seasonal crop water requirements is crucial for planning your crop planting mixture especially during drought years. For example, in the Greeley area, the seasonal water use of sugar beets is 27.1 in. while corn uses only 23.9 in. of water. That means, to fully irrigate sugar beets you need to apply 13% more water as compared to corn. These water requirements are net crop water use, the amount that the crop will use (not counting water losses) in an average year, given soil moisture levels didn’t fall below critical levels. Under ideal conditions this net water requirement is reduced by the effective rain, which for the Greeley area is 6.5 inches for the growing season and effective stored soil moisture at the beginning of the season. Beginning soil moisture will also supply some water for ET. If soils are at field capacity at planting, 50% of that water holding capacity in the effective root zone is useable by the plant. A sandy loam soil holds approximately 1.4 inches per foot of soil (Irrigation Scheduling: The Water Balance Approach – 4.707). Assuming field capacity and a 3 foot effective root zone, a sandy loam soil will supply 2.1 inches of moisture. If soil moisture is less than field capacity at planting, that moisture must be supplied by irrigation.
The rest of the crop water requirement must be supplied by irrigation. No irrigation system is 100% efficient, so to apply the net water requirement to the entire field the amount of water applied should be increased ( divided by the efficiency) of the irrigation system. Looking at the above example the net water requirements, after subtracting effective rain and stored soil moisture, are 18.5 in. for sugar beets and 15.3 in. for corn. If the irrigation system is 85% efficient, 21.8 in. (gross irrigation amount; 18.5/0.85) must be applied to the sugar beets crop and 18.0 in. to the corn crop in order to store the net water requirement in the crops’ root zone. Now the difference between the seasonal gross water requirements of sugar beets and corn is 21%. The difference in the gross irrigation requirement amounts increases as the irrigation system efficiency decreases.
Net Crop Water Requirement
Net crop water requirement is estimated using models, which are based on weather data. Seasonal crop water requirement can be estimated using these models by averaging weather conditions for many years, creating an average weather year. Tables 1 and 2 are a summary of net water requirements of different crops and effective precipitation for different locations in eastern Colorado and western Colorado, respectively. To figure the net irrigation requirement subtract the effective rain (Av. Effective Precipitation from Tables 1 and 2) and available stored soil moisture from the net crop water requirement. The gross irrigation water requirement is the net irrigation requirement divided by the irrigation system efficiency (fraction of one). For example, corn for grain in Burlington requires 26.2 in. of water. Effective precipitation is 8.1 in. for the season, therefore the net irrigation requirement is 18.1 in. before soil moisture is accounted for. A silt loam soil will hold 2.2 inches per foot. Assuming a 3 foot root zone and 50% allowable depletion, 3.3 inches of water are useable and reducing net irrigation requirement to 14.8 inches. The gross irrigation requirement for a center pivot with 80% irrigation efficiency is 18.5 in. For a furrow irrigation system with 55% irrigation efficiency the gross irrigation requirement is 26.9 in.
| Table 1. Estimated seasonal water requirement (consumptive use) in eastern Colorado (inches/season). | ||||||||||||
| Burlington | Cheyenne Wells | Penrose | Holly | Greeley | Lamar | Ft. Lupton | Rocky Ford | Walsh | Iliff | Trinidad | Wray | |
| Alfalfa | 44.1 | 51.6 | 46.2 | 46.3 | 37.1 | 49.7 | 43.5 | 45.7 | 59.0 | 39.2 | 46.4 | 26.2 |
| Grass hay/pasture | 29.9 | 35.2 | 31.4 | 31.5 | 25.7 | 33.8 | 29.8 | 31.0 | 39.9 | 26.9 | 31.5 | 25.0 |
| Dry beans | 15.7 | 21.8 | 19.7 | 19.3 | 15.7 | 20.8 | 17.7 | 18.4 | 24.6 | 16.9 | 18.4 | 16.6 |
| Corn, grain | 26.2 | 28.2 | 26.6 | 26.3 | 23.9 | 27.4 | 25.9 | 26.5 | 29.3 | 24.5 | 26.7 | 24.5 |
| Corn, silage | 25.2 | 27.2 | 25.6 | 25.3 | 22.9 | 26.4 | 24.9 | 25.5 | 28.3 | 23.5 | 25.7 | 23.5 |
| Corn, sweet | 24.0 | 25.8 | 24.3 | 24.1 | 21.9 | 25.1 | 23.7 | 24.3 | 26.8 | 22.5 | 24.5 | 22.4 |
| Cantaloupe | 17.2 | 23.3 | 20.8 | 20.8 | 17.2 | 22.3 | 19.1 | 20.6 | 26.2 | 17.9 | 20.6 | 16.4 |
| Potatoes | 24.0 | 30.0 | 27.1 | 26.9 | 20.2 | 29.3 | 25.3 | 25.5 | 36.2 | 21.7 | 26.3 | 20.5 |
| Onion | 27.6 | 31.3 | 28.5 | 28.6 | 24.2 | 30.2 | 27.5 | 28.2 | 34.1 | 25.3 | 28.6 | 24.2 |
| Small vegetables | 22.7 | 31.5 | 28.5 | 28.2 | 22.7 | 30.2 | 25.4 | 27.0 | 36.0 | 24.1 | 27.0 | 23.2 |
| Sorghum, grain | 20.9 | 28.8 | 25.7 | 25.6 | 20.9 | 27.4 | 23.4 | 24.9 | 32.7 | 22.2 | 24.9 | 21.0 |
| Soybeans | 22.2 | 26.0 | 23.2 | 23.3 | 18.7 | 25.0 | 21.9 | 23.0 | 29.7 | 19.7 | 23.3 | 18.2 |
| Spring grains | 22.6 | 30.6 | 24.7 | 25.8 | 20.6 | 27.7 | 23.0 | 23.4 | 36.7 | 24.8 | 24.3 | 18.9 |
| Sugar beets | 33.7 | 37.9 | 35.0 | 34.7 | 27.1 | 37.3 | 32.8 | 34.9 | 43.6 | 29.0 | 35.3 | 28.4 |
| Wheat, winter | 18.7 | 19.0 | 19.0 | 18.5 | 17.9 | 19.1 | 18.4 | 19.2 | 19.8 | 17.9 | 19.2 | 15.5 |
| Av. Precipitation | 10.3 | 9.1 | 6.4 | 8.3 | 8.6 | 9.2 | 4.6 | 6.2 | 8.5 | 10.9 | 6.1 | 10.4 |
| Av. Effective Precipitation Summer Crops |
8.1 | 7.8 | 5.2 | 7.0 | 6.5 | 7.8 | 3.6 | 5.1 | 7.4 | 8.7 | 5.1 | 7.2 |
| Av. Effective Precipitation Winter Wheat |
6.8 | 6.3 | 4.6 | 6.6 | 5.4 | 6.4 | 5.8 | 4.9 | 7.0 | 6.5 | 5.2 | 7.4 |
| Table 2. Estimated seasonal water requirement (consumptive use) in western Colorado (inches/season). | ||||||||||
| Canon City | Cortez | Mancos | Gunnison | Fruita | Silt | Bedrock | Salida | Walden | ||
| Alfalfa | 41.0 | 37.3 | 38.4 | 27.0 | 44.0 | 29.3 | 37.6 | 36.2 | 35.1 | |
| Grass hay/pasture | 28.0 | 25.5 | 26.2 | 19.1 | 30.0 | 21.0 | 25.5 | 25.0 | 24.4 | |
| Dry beans | 15.4 | 18.1 | 15.4 | 12.7 | 18.1 | 14.6 | 13.4 | 14.3 | 15.1 | |
| Corn, grain | 25.5 | 24.7 | 24.9 | 19.5 | 26.9 | 20.8 | 24.6 | 24.2 | 23.6 | |
| Corn, silage | 24.5 | 23.7 | 23.9 | 18.5 | 25.9 | 19.8 | 23.6 | 23.2 | 22.6 | |
| Corn, sweet | 22.3 | 20.3 | 20.9 | 14.7 | 24.0 | 15.9 | 20.5 | 19.7 | 19.1 | |
| Cantaloupe | 17.4 | 20.3 | 17.4 | 12.6 | 20.3 | 14.6 | 16.9 | 16.3 | 15.9 | |
| Potatoes | 23.1 | 20.1 | 20.9 | 14.2 | 24.2 | 16.8 | 19.0 | 18.0 | 19.6 | |
| Onion | 26.3 | 24.7 | 25.1 | 19.9 | 28.0 | 19.4 | 24.7 | 24.4 | 23.5 | |
| Small vegetables | 23.1 | 26.2 | 23.1 | 17.9 | 26.2 | 19.8 | 21.2 | 21.8 | 22.5 | |
| Sorghum, grain | 21.0 | 24.5 | 21.0 | 16.1 | 24.5 | 18.7 | 20.2 | 19.5 | 19.8 | |
| Soybeans | 20.7 | 18.8 | 19.3 | 13.6 | 22.2 | 14.7 | 18.9 | 18.2 | 17.7 | |
| Spring grains | 19.8 | 18.3 | 18.4 | 17.0 | 22.2 | 19.0 | 17.6 | 19.0 | 20.3 | |
| Sugar beets | 31.6 | 28.9 | 29.6 | 19.4 | 33.7 | 19.2 | 29.3 | 27.0 | 25.5 | |
| Wheat, winter | 18.8 | 18.6 | 185 | 16.1 | 19.0 | 9.6 | 18.9 | 18.4 | 16.8 | |
| Av. Precipitation | 6.2 | 4.0 | 6.3 | 4.9 | 3.6 | 7.3 | 9.5 | 5.3 | 5.0 | |
| Av. Effective Precipitation Summer Crops |
5.2 | 3.3 | 5.2 | 3.7 | 3.1 | 5.5 | 7.6 | 4.3 | 4.2 | |
| Av. Effective Precipitation Winter Wheat |
5.1 | 5.4 | 6.9 | 4.0 | 4.1 | 5.2 | 5.6 | 4.0 | 4.6 | |
Limited Irrigation
When water supplies are restricted in some way, so that full ET demands cannot be met, limited irrigation results. Reasons that producers may be limited on the amount of available water include: 1) Limited capacity of the irrigation well – In regions with limited saturated depth of the aquifer, well yields can be marginal and not sufficient to meet the needs of the crop; 2) Reduced surface water storage – In regions that rely upon surface water, droughts and seasonal fluctuation affect the water allocations available for users.
When producers cannot apply water to meet the crop ET, they must realize that with typical management practices, yields and returns will be reduced as compared to a fully irrigated crop. To properly manage the water for the greatest return, producers must have an understanding of how crops respond to water, how crop rotations can enhance water availability, and how changes in agronomic practices can influence water needs.
Yield vs. ET and Irrigation
 |
|
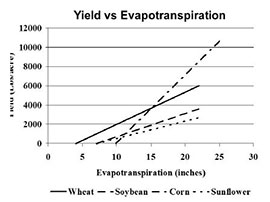
Figure 1: Yield vs. ET relationship for several irrigated crops.
|
er that is used by the crop (Figure 1). Crops such as corn, respond with more yield for every inch of water that the crop consumes as compared to winter wheat or sunflower. High water use crops such as corn require more ET for plant development or maintenance before yields are produced. Corn requires approximately 10 inches of ET as compared to 4.5 and 7.5 inches of ET for wheat and sunflower. These crops also require less ET for maximum production compared to corn.
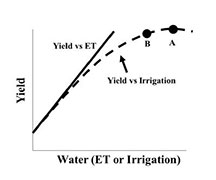
In Colorado’s semi-arid climate, irrigation is important to increasing ET and grain yields. Irrigation is used to supplement rainfall in periods when ET is greater than precipitation. However, not all of the water applied by irrigation can be used for ET. Inefficiencies in applications by the system result in losses. As yield is maximized, more losses occur since the soil is nearer to field capacity and more prone to losses such as deep percolation (Figure 2). Water can be saved by applying less water than is needed for maximum yield. As seen in Figure 2, a reduction in water applied from point A to point B can save water with little or no yield reduction.
 |
|
Figure 2: Generalized Yield vs. ET and Yield vs. Irrigation production functions.
|
Limited Water Management – Reduced Allocations
When producers are faced with reduced surface water storage, they have three management options that can be utilized. Producers could 1) reduce irrigated acreage, 2) reduce irrigation to the entire field or 3) include different crops that require less irrigation. Option 1 idles potentially productive ground which can be utilized for dryland production, while option 2 reduces yields for the irrigated acres unless precipitation is above normal. Option 3 incorporates the use of crops that require less irrigation for maximum production and then uses the “saved water” for traditionally irrigated crops.
An example for Wray and a sandy loam soil would be irrigating all corn or irrigating some corn and dry beans. Corn requires 17.8 inches of irrigation (85% efficiency) and dry bean requires 8.6 inches. If the allocation from the ditch limits a producer to 14 inches of water the producer could raise 80% of their acres to irrigated corn and the remainder in dryland production or idle. He could also raise 100% of his acres to corn and apply only 80% of the irrigation required for maximum production. The final option would be that he could raise 40% of his acres to dry bean and 60% of his acres to corn and maintain maximum production on all of his acres.
Limited Water Management – Low Capacity Systems
When managing for maximum production, irrigation systems must have minimum capacities that meet crop water requirements during peak water use periods. If irrigation system capacities are below what is normally required, reduced yields are expected with normal precipitation. Management strategies to compensate for low capacity include pre-irrigation and beginning irrigation at higher soil moisture contents. These strategies may maintain yields in above normal precipitation years but do not help as much in below normal precipitation years. Management strategies to alleviate this problem include splitting systems into 2 or more crops that have different peak water needs, thus reducing the rate of water requirements during both peak periods.
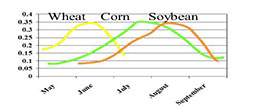 |
| Figure 3: Example of daily ET during the growing season. |
Crop rotations also spread the irrigation season over a greater time period as compared to a single crop. When planting multiple crops such as corn and winter wheat under irrigation, the irrigation season is extended from May to early October as compared to continuous corn, which is predominantly irrigated from June to early September.
Crops such as corn, soybean and wheat have different timings for peak water use (Figure 3). With low capacity wells, planting multiple crops with smaller acreages allows for water to be applied at amounts and times when the crop needs the water. The net effect of irrigating fewer acres at any one point in time is that ET demand of that crop can be better met. If capacities are increased by splitting acres into crops that have different water timing needs, management can be done to replace stored soil moisture rather than maintaining soil moisture near field capacity in anticipation of crop ET since the system will not meet ET.
Another option is to plant the entire pivot or field to a single crop. Irrigation management with low capacity systems requires that a producer maintain soil moisture at or near field capacity when ET is less than what the system can apply. When the ET for the crop is greater than the capacity of the system, plants will use stored soil moisture to maintain ET. This type of management is necessary to insure that moisture will be available for plants when they reach the reproductive growth phase. However, if precipitation is less than anticipated, soil moisture may be less than 50% of available water capacity during the reproductive growth stage and yields will be reduced.
The development of this fact sheet was supported by the National Institute of Food and Agriculture, U.S. Department of Agriculture, under award number 2016-68007-25066, “Sustaining agriculture through adaptive management to preserve the Ogallala aquifer under a chang-ing climate” and U.S. Department of Agriculture – Risk Management Agency.
*J. Schneekloth, Colorado State University Extension water resource specialist, U. S. Central Great Plains Research Station, Akron, Colorado; A. Andales, Colorado State University assistant professor, soil and crop sciences. 4/03. Revised 2/17.
Go to top of this page.