by C. Weiner and I. Shonle* (11/14)
Quick Facts…
- A power monitor is a device that can help you understand your home’s electricity consumption.
- Phantom loads can account for up to 10 percent of the average household’s electricity consumption.
- Appliances that cycle, such as refrigerators and water heaters, will need to plugged in for a longer period to capture true usage.
- A spreadsheet accompanies this fact sheet to calculate the cost of running these appliances.
A power monitor is a device that will help you understand your home’s electricity consumption. It can be used for everything from deciding whether it’s time to replace your old refrigerator to reducing ‘phantom loads’—the electricity used when devices are in stand-by mode (which can account for up to 10 percent of the average household’s electricity consumption).
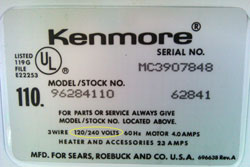
Figure 1. Check the voltage of appliances before plugging them into a power monitor. |
The power monitor can be used on any device with an electrical plug, but it is only intended to measure 120V loads (standard U.S. household loads). Look for the volts on the appliance tag (see Figure 1). Appliances that may draw more than 120 V include but are not limited to: clothes dryers, most electric water heaters, some electric ranges, and some well pumps. Appliances that use electricity but can’t be measured by this device include furnaces, central air conditioners, and most well pumps, so be aware that you may only be able to measure a portion of your electricity consumption.
The worksheet that accompanies this fact sheet will calculate the cost of running these appliances. It can be used to understand how much electrical appliances cost under two different rate structures: General or flat rate (GR) and Time-of-Use (TOU). It can also be used to compare how much appliances would cost to operate under one’s current usage patterns versus how much they would cost to operate under different usage patterns (i.e. operated using less wattage, less frequently, and/or at different times of the day).
Functions of a power monitor
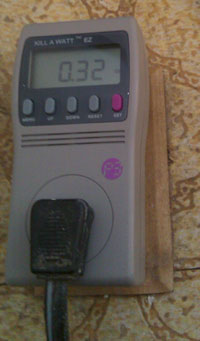
Figure 2. A power monitor in use. |
Power monitors have various functions that allow you to check different aspects of electricity usage. For testing energy use, the most important ones are Watts (W) and kilowatt hours (kWh). The Watts function measures the instantaneous draw (how much electricity a device is using), whereas the kWh gives the measure of electricity usage over time. For example, a 1,000 watt electric heater running for one hour will use one kWh of electricity.
Many power monitors also allow for electricity use to be converted into cost. While a default value (i.e. $0.10 per kWh) may be pre-entered on a power monitor, monitor users should enter the rate they are charged by their local utility to get the most accurate cost estimates from the monitor.
Functions of less relevance for energy efficiency include Volts (your reading should be close to 120.0, the standard voltage in U.S. electrical outlets), Amps (the measure of the flow rate of electric current), and HZ/PF (60 hertz cycles per second is the standard for alternating current in U.S. electrical outlets).
With some monitors, the accumulated kWh data will be ‘lost’ when the monitor is disconnected at the end of the monitoring period, so be sure to record the amounts before disconnecting.
Using the worksheet
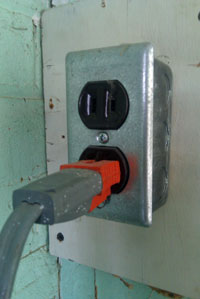
Figure 3. Some outlets require use of a 3-prong adapter to host a power monitor. |
Make a list of all the 120 V appliances in your house, and enter them into the worksheet. Many typical appliances are already listed, but add more as necessary. Plug each piece of equipment you want and are able to evaluate into the monitor; if you have older two-prong outlets you may need a three-prong adapter (see Figure 3).
Fill in the watts the appliance draws both while turned ‘on’ and ‘off’. The watts drawn while ‘off’ constitute your phantom load.
Note that the worksheet consists of two ‘tabs’–General Rate and Time-of-Use. For most residential customers on a flat rate, the general rate tab will be sufficient for understanding your current and potential electricity uses and costs. For those under a TOU rate or for those interested in analyzing electricity use and cost under such a rate, data should be entered in the Time-of-Use tab.
The default cost of electricity on the worksheet is $0.11 per kWh for the general rate and $0.17 and $0.06 for on- and off-peak TOU rates respectively. Check your electric bill and enter the actual cost per kWh. If you know the different rates for TOU, enter those in as well; otherwise use the defaults.
Special cases
Some appliances such as fans, space heaters, and hair dryers have multiple settings. You can see the savings potential for using these devices at lower settings by either recording the watts at different settings in different rows, or by recording it in the ‘potential’ column.
Other appliances may have large fluctuations in their electricity use when actively on. For example, a hair dryer ranged from 240 to 1,000 watts when on high. In this case, take the average of the high and low (620 watts) and enter that into the ‘on’ column.
Still other appliances have such a low draw that they may not immediately register. These may include LED nightlights and carbon monoxide detectors. The electricity usage of these is so small that it may not be worth capturing even over a longer period. It’s most important to get accurate readings for the appliances that use the most electricity such as refrigerators or large screen televisions.
Appliances that cycle
Appliances that cycle, such as refrigerators and water heaters, will need to be plugged in for a longer period (ideally 24 hours) in order to capture the true usage. To get kWh per month for cycling appliances, multiply the kWh used over that period (most power monitors will track the time an appliance is monitored as one of its functions) times the number of those periods/month. If using the TOU tab multiply that number by the percentage of time the appliance is on-peak and off-peak and enter your results directly into Columns G and H (On and off-peak kWh/month). Appliances that cycle on and off evenly throughout the day and night would be on-peak 17.9 percent of the time under the default peak hour schedule of 2:00–8:00 p.m. Monday through Friday.
Example refrigerator
- 1.39 kWh over 21 hours
- 720 hours/month divided by 21 hours = 34.3 periods/month
- 1.39kWh * 34.3 = 47.68 kWh/month
- 47.68 kWh/month * 17.9% on-peak = 8.53 kWh/month on-peak
- 47.68 kWh/month * 82.1% off-peak = 39.15 kWh/month off-peak
Example washing machine
- 0.18 kWh over one cycle
- Six cycles per week = 24 cycles/month
- 0.18 kWh * 24 = 4.32 kWh/month
- 4.32 kWh/month * 25% on-peak = 1.08 kWh/month on-peak
- 4.32 kWh/month * 75% off-peak = 3.24 kWh/month off-peak
Electric clothes washers and dishwashers also have varying wash and heat settings that affect energy use. Monitoring a single use (e.g., one dishwasher load, or an average load of clothes) will be enough to get the data you need if you usually use those same settings. However, you can use the monitor to test the electrical use for various settings. Then you can select the setting with the lowest possible electrical use that still achieves the results you want (e.g., clean dishes, dry clothes). To determine energy savings, record the lowest setting in the ‘potential’ column under ‘Watts-on’ (Column H for the GR tab and Column J in the TOU tab).
Air conditioners and dehumidifiers turn on automatically based on settings and atmospheric conditions. They can be set at varying humidity levels and fan speeds, both of which affect electric usage. Depending on the weather, a few to several days’ worth of data may be needed to get an accurate picture of energy use. Viewing the watts usage at different settings may help you in establishing an efficient setting for your situation.
Appliances that have passive and active settings
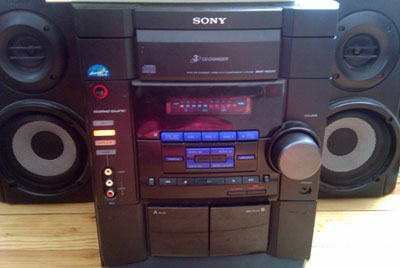 Figure 4. This stereo uses 15 watts when ‘off’ under a certain display setting. |
Some appliances such as computers and printers use significantly different amounts of energy when ‘on’ depending on whether they are actively ‘on’ or passively ‘on’. Computers are actively on when being used or not in sleep mode. Printers are actively on when printing, not standing by.
It is best to capture the cycling of these active and passive stages over a representative period of time as is done with refrigerators and water heaters. A less accurate means of calculating wattage when ‘on’ would be to record the most common wattage (active or passive) or to take the average of the active and passive wattages, if they are not too far apart.
Maximizing your “potential” savings
Use the “potential” columns to compare the cost of using an appliance at different wattage settings. The lower wattage would be entered into the “potential” column (Watts-on) if you currently use the appliance at a higher wattage.
Next, see what you would save by cutting your phantom loads. For each appliance that has a wattage draw even when turned off, enter a ‘0’ in the potential ‘Watts-off’ column. To actually achieve these cost savings, plug each of these devices into an outlet strip and switch it off when you’re not using the device or consider the use of a ‘smart strip’ that automatically cuts phantom loads when the device isn’t in use.
The ‘potential’ columns can also allow you to compare the cost of running your current appliance with that of a new, more efficient version. To do this, look for the Energy Guide labels or other estimates of the electricity use of the new appliance. Divide the annual estimated kWh of the new appliance by 12. If using the TOU tab, multiply that number by the percentage of time the appliance is on-peak and off-peak and enter your results directly into Columns N and O (On and off-peak kWh/month).
You can also use these columns to calculate the cost of using an appliance at different times of day if using the TOU tab. Some utility companies charge different rates at different times of the day in order to encourage people to reduce their demand on the system during peak loads (on-peak hours are often 2:00–8:00 p.m. Monday through Friday; this is the default setting for the TOU tab). Consider whether you have the ability to shift when you use the appliance to a different time of day (i.e. running a dishwasher at night instead of right after dinner or putting a timer on an electric water heater to run off-peak). Several newer appliances can be programmed to automatically start later in the day, potentially avoiding peak-hour premiums. If you might be able to shift your habits to use less electricity during on-peak hours, enter a lower ‘% on-peak’ figure for relevant appliances in Column M (% on-peak).
Experiment and have fun
Watch the wattage when you open your refrigerator door, switch from radio to CD, or play a video on your computer versus typing a document. The power monitor will give you insight into your electrical usage and the knowledge to make cost-effective decisions.
*C. Weiner, Colorado State University, clean energy Extension specialist. I. Shonle, Gilpin County Extension, county director. 5/11. Revised 11/14.
Go to top of this page.