A Price Slide Decision Making Tool
J.A. Beiermann, B.P Lee, J.D. Derner, J.P. Ritten

How does the price slide affect yearling steer marketing decisions?
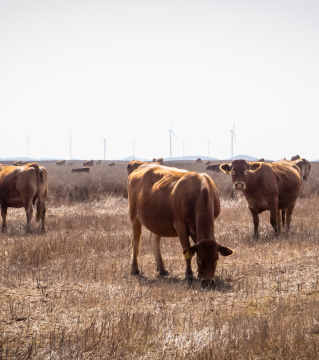
The question of when to market yearling cattle is a decision that can determine the level of profitability or loss each year for many producers in Wyoming and Colorado. This decision is based on how markets are performing, feed availability, and past experiences. However, could producers use data-informed knowledge of past market performances to enhance their decision making for more effectively marketing their yearling steers?
In years when substantial price swings can influence profitability/loss, data-informed decisions can help maximize value from the market. The price slide is the market phenomenon where cattle value per head tends to increase as live weight increases, even though the value per pound decreases. Further, this phenomenon is dynamic as it can change both within and across years.
The phenomena of price slide is well known in the livestock industry, but it is rarely accounted for when making marketing decisions. In this study, we build on previous work by Baldwin 2021, Baldwin et al. 2021, and Ritten et al. 2018 by developing a monthly price slide tool for the most common marketing months specific to Colorado and Wyoming. The final objective of expanding on this work is to build a decision-making tool that will assist producers in their marketing timing decision to maximize profit.
Project Goals
Dynamic cattle markets challenge producers for marketing decisions. The magnitude of the price slide is affected by factors similar to those influencing general cattle market prices and expectations. This tool will help to assist producers in identifying target prices given current (or expected) steer weight. As heavier steers bring lower prices per pound, animal value increases at a slower rate than weights.
Therefore, if the price slide disparity is large enough, it can have a substantial impact on profit/loss. For example, to illustrate the price slide in action, if the average price of a 775 lb steer is $140/cwt (price per hundred weight) and the average price of an 875 lb steer is $134/cwt, how much more is the 875-lb steer worth?
One might think: $134/cwt, which is the difference in weight multiplied by the new price. But, the answer is actually $87.50. Due to the price slide, the first 775 pounds of the 875 pound animal take a discount of $0.06/lb (which is the difference in $1.40-$1.34). So the question we should ask next: What are the factors that influence the price slide, and in what ways can we expect them to influence it?
Data
We used steer sales data for Wyoming and Colorado from live sale auctions, compiled from USDA-NASS 1992 – 2021 data for 100 lb. increments for feeder steer sales which were normalized to 2021 dollars using the Producer Price Index. Cattle price data for the months of July through November were compiled for both Wyoming and Colorado.
Fed steer prices and December futures corn prices were needed to formulate the regressions for calculating the price slide and its effect on gross returns. The regressions allow the tool to describe how the inputs contribute to output prices. Fed steer prices and December futures corn prices were used to estimate the cost of feeding these steers during different periods of the year and the number of days on feed. These data were taken from USDA-NASS and matched the feeder steer prices range from 1992-2021. All data was again normalized to 2021 dollars to account for inflation.
Analysis
Regressions were compiled for each of the traditional marketing months from August to November for Colorado and Wyoming. The specific monthly price slide is:
Pricecwt(W, PCorn, PFed)= b0+b1W+b2W2+b3W3+b4PCorn+b5WPCorn+b6*PFed
Where Pricecwt is the price per hundred weight of steers, W is actual (or forecasted weight), PCorn is the nearest December futures price for corn, and PFed is the nearest December futures price for fed cattle.
The tool accounts for marketing months August through November in Wyoming and Colorado. The tool calculates the estimated marketing values based on current or estimated animal weights for each of the forecasted months. Producers can then determine optimal marketing months based on forecasted animal gains, cattle prices, and expectations for remaining seasonal forage availability.
Results
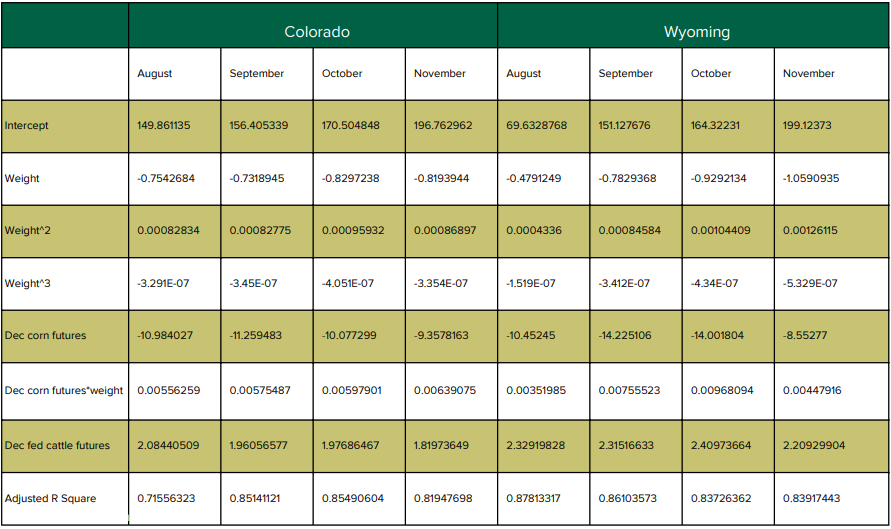
The results of the regression (Table 1) describe which of the inputs have the biggest impact on steer market value. The regression results vary across months and weights marketed. Depending on the inputs provided by producers for specific situations, the tool provides optimal marketing time for the user’s scenario.
Table 1 – Coefficients of Regression
User Interface
When producers use and access the tool, they simply need to input December corn futures prices, December fed steer prices, and either their current or estimated animal weights. The tool will then determine, using the regressions and compiled data, the estimated steer values for each of the marketing months.
The tool identifies changes in steer values from the previous marketing month. So, as the change in value from the previous month increases, the additional weight added to the animal is positively impacting the value of that steer in dollars. As the change in value decreases from the previous month, the additional weight on the animal is negatively impacting the value of that steer in dollars.
Tool Implications for Marketing Decisions
This tool leads to many implications for marketing decisions. This tool can help producers better understand the financial implications of stocking (and destocking) decisions, especially during times of drought (Figure 2).
Drought is a persistent threat to livestock producers in the western US, and this tool can easily help producers mitigate drought issues and maintain profitability. This tool is designed to become an integral part of a formal drought plan for producers based on management alternatives for drought challenges. For stocking decisions, this can help producers determine the best number of steers and weights of steers to maximize their profit. It could also prove helpful in determining their weaning or shipping date.
Figure 2 – Potential Marketing Decisions
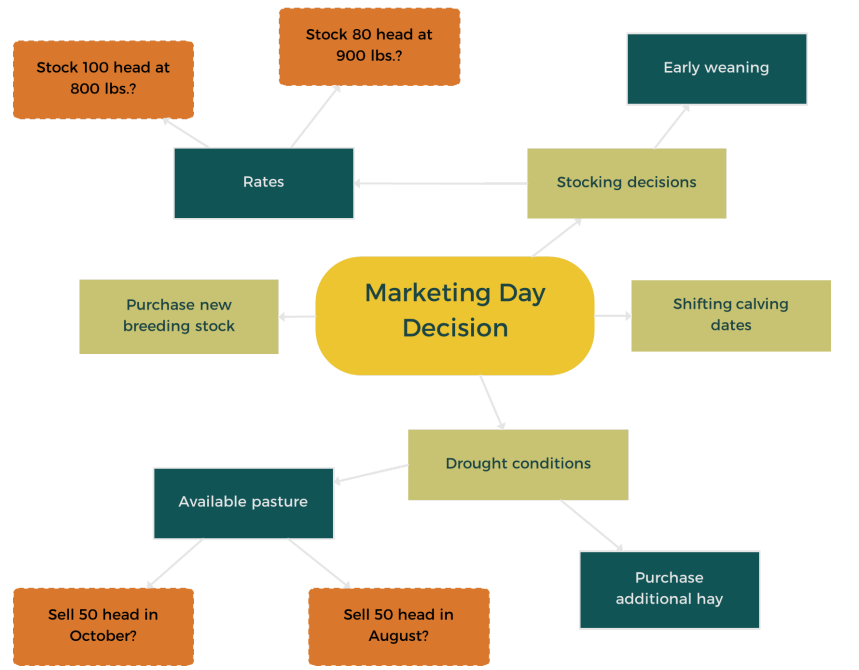
Additional considerations include the determination of calving dates and whether or not to purchase new breeding stock for the herd. Calving earlier or later can affect the date at which target weights are achieved. Also, purchasing new bulls or breeding females can affect birth weight, weaning weight, and average daily gain – all of which can be accounted for when running scenarios through the decision tool.
Where to find this tool?
This tool will provide value in all years by helping producers understand how current market conditions impact steer values, thus allowing producers to alter timing of marketing animals of various weight classes.
Further, this tool is designed to become an integral part of a formal drought plan for producers to base management alternatives for drought challenges.
Adaptive management may have the potential for greater net returns by altering annual stocking rate decisions and/or marketing livestock at various times of the year.
Effectively Marketing in a Complex Cattle Market
The complexity of cattle market prices and the price slide leads to our one of the main challenges faced by producers: how can we take this uncertainty and use it advantageously to determine when to sell yearling steers? Paying close attention to the December futures corn and live cattle fed futures markets can assist producers in understanding how these two factors impact the value of the weight gained by their steers.
Price slide considerations are one piece of the puzzle for management strategies. In years with high corn prices, the decision to have fewer, heavier weight cattle, as opposed to more, lighter-weight cattle, may overcome the discount caused by the price slide, as the discount for heavier cattle is decreased in years with high feed costs.
By understanding how current market forces are impacting steer prices at varying weights, this sort of adaptive management may have the potential for greater net returns by altering annual stocking rate decisions and/or marketing livestock at various times of the year.
References
Baldwin, T. 2021. The Stocker Steer Quandary: Stocking Rate, Marketing Date, and Price Slides in Northeastern Colorado. University of Wyoming.
Baldwin, Tevyn, John Ritten, and Justin Derner. 2021. The Stocker Steer Quandary: The Price Slide. B-1371, University of Wyoming Extension, College of Agriculture and Natural Resources, University of Wyoming, Laramie.
Ritten, John, Steven Paisley, Bridger Feuz, and Hudson Hill. 2018. “What is the Price Slide?” Fact Sheet. Bulletin B-1319. University of Wyoming Extension, College of Agriculture and Natural Resources, University of Wyoming, Laramie.